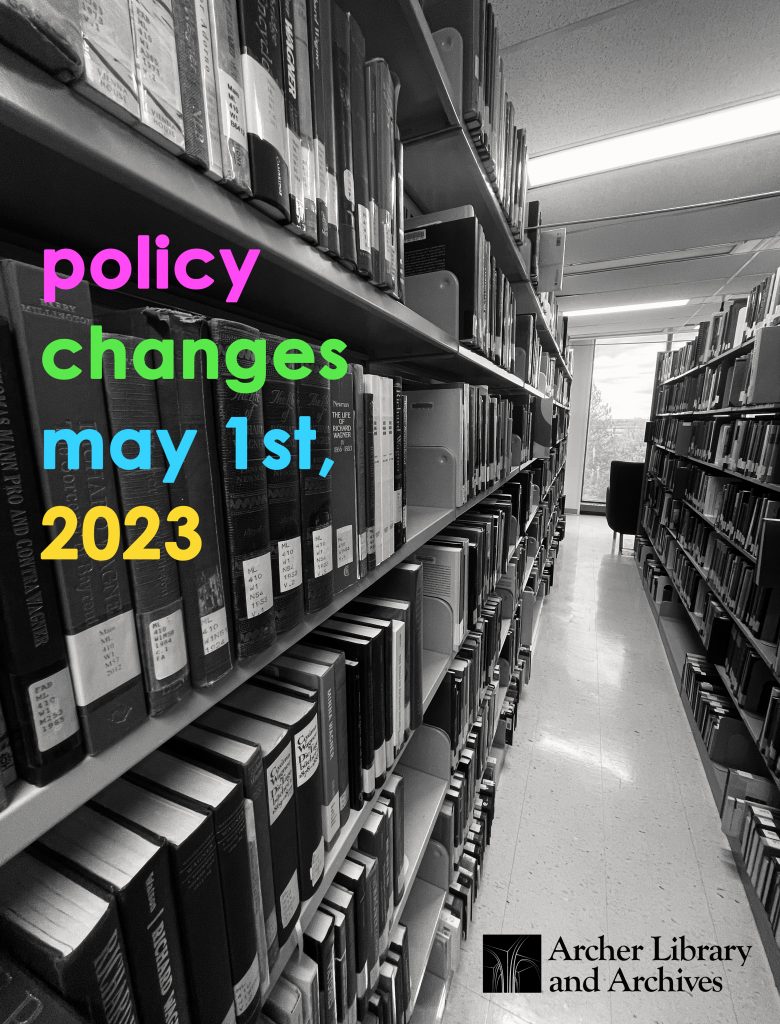
Heads up! We are updating a few of our policies May 1st to help better serve our patrons. Changes include:
Overdue fines for regular loans will be eliminated. However, overdue fines will continue to be charged for laptops, reserve items, and recalled items. The elimination of overdue fines for regular loans will apply to Archer, Campion, Luther, and TPC Libraries. First Nations University Libraries will continue with their existing overdue fine policies.
Reserve items are declared lost three days after their due date. After reserve items have been declared lost, the patron is responsible for payment of their associated lost fees.
After 60 days, outstanding Archer Library lost charges on patron accounts will be transferred to Financial Services for collection. Lost items may be returned for refund of their lost fees prior to their transfer to Financial Services. However, lost fees will not be refunded after they have transferred to Financial Services.
Laptop loans are being extended from 3 days to 5 days. On the 5th borrowing day, laptops are due by 6:00 pm (extended from the previous due time of 12 noon.)
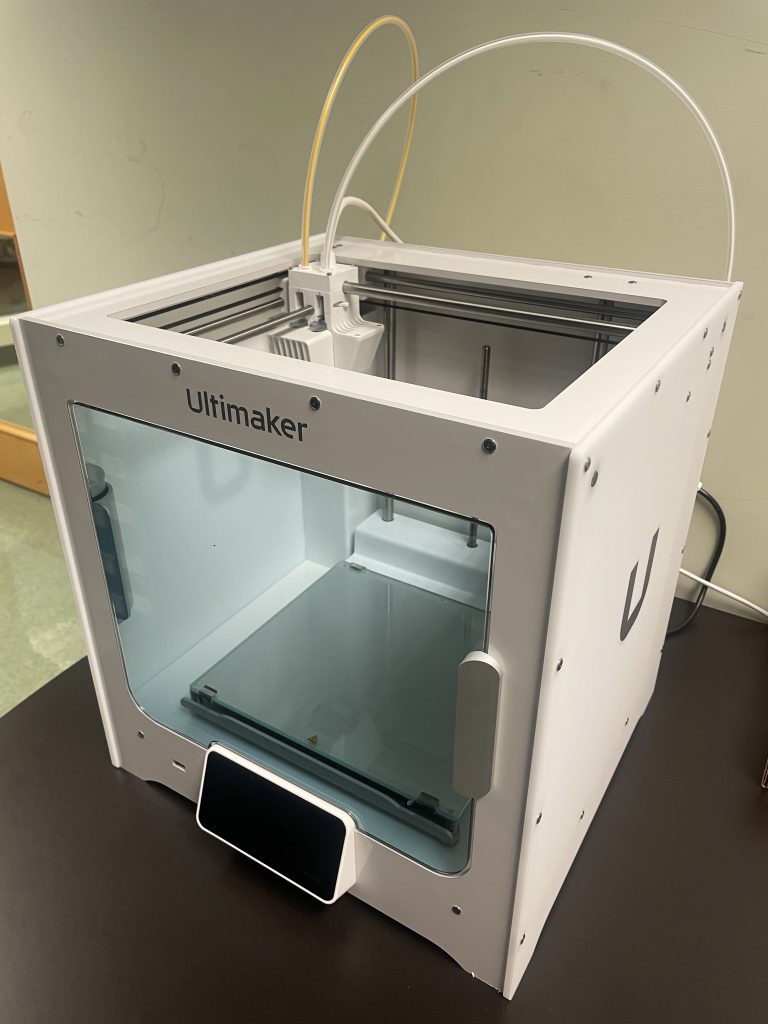
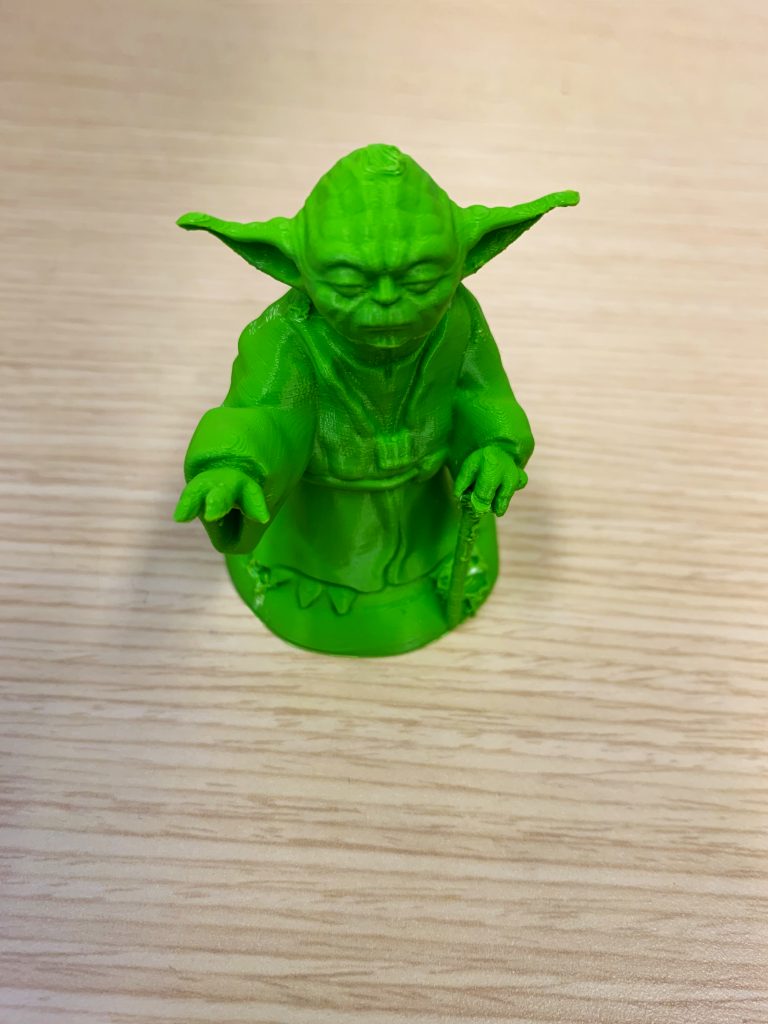
We also have a more detailed Library Guide about 3D printing that gives more information on the Ultimaker S3, the process of 3D printing and more, available here: https://library.uregina.ca/3Dprinting
For more information, questions, and class inquiries please contact us here: 3D.Library@uregina.ca
Please feel free to forward this information to your classes, students, and relevant parties.
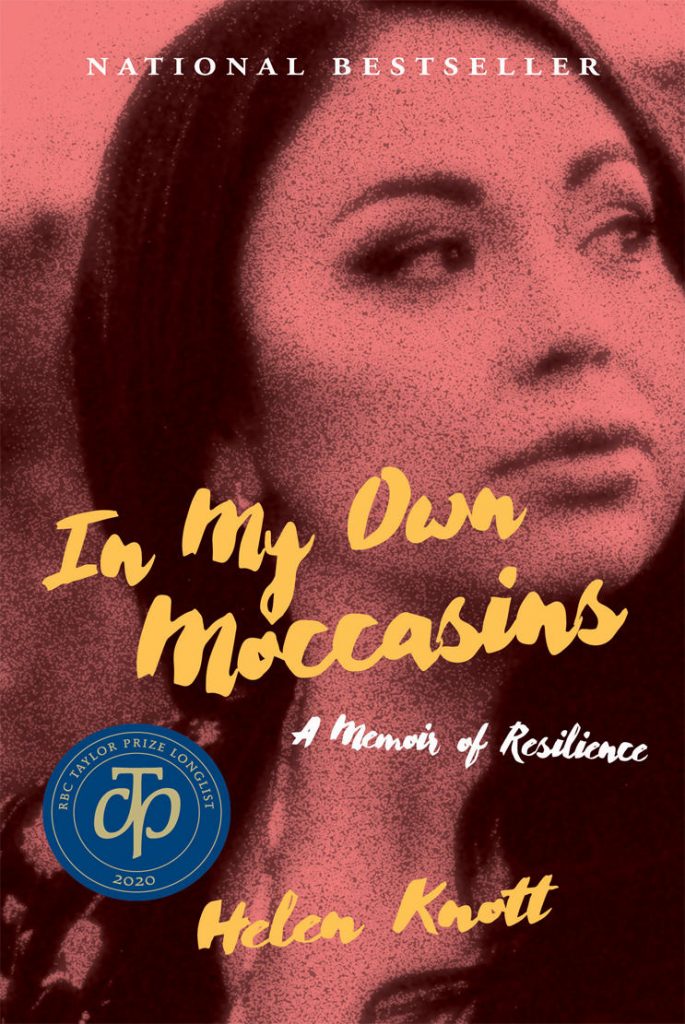
In My Own Moccasins : a Memoir of Resilience by Helen Knott. In My Own Moccasins is an unflinching account of addiction, intergenerational trauma, and the wounds brought on by sexual violence. It is also the story of sisterhood, the power of ceremony, the love of family, and the possibility of redemption.
This is one of eight U of R Press books that have been national best sellers. It was also the winner of the Saskatchewan Book Award for Indigenous Peoples for 2020.
Available through the Archer Library in both print and e-book format:
We are pleased to share that Stephanie Ndulue has joined us as our Discovery Technologies Student Assistant. Stephanie is a Masters student in Software Systems Engineering, previously worked as a Junior Software Engineer at the Nigerian Television Authority, and is a volunteer at the TPC Library. Stephanie will be helping us perform routine computer updates, troubleshoot technical issues, and ensure that the website and UR Source are up to date. Stephanie will be here Wednesday mornings, Thursday afternoons, and all day Fridays until the end of August.
Sisi, Li, joined the Archer as Collections Review Student Assistant this week. Sisi is currently studying for an interdisciplinary doctoral degree at the University of Regina, Canada. Her study places Asian collections in the social and cultural context of Canada, exploring the relationship between objects and people, objects and museums, and museums and society. Her research interests include cross-cultural collecting, multiculturalism, decolonization, and new museology. Welcome, Sisi!
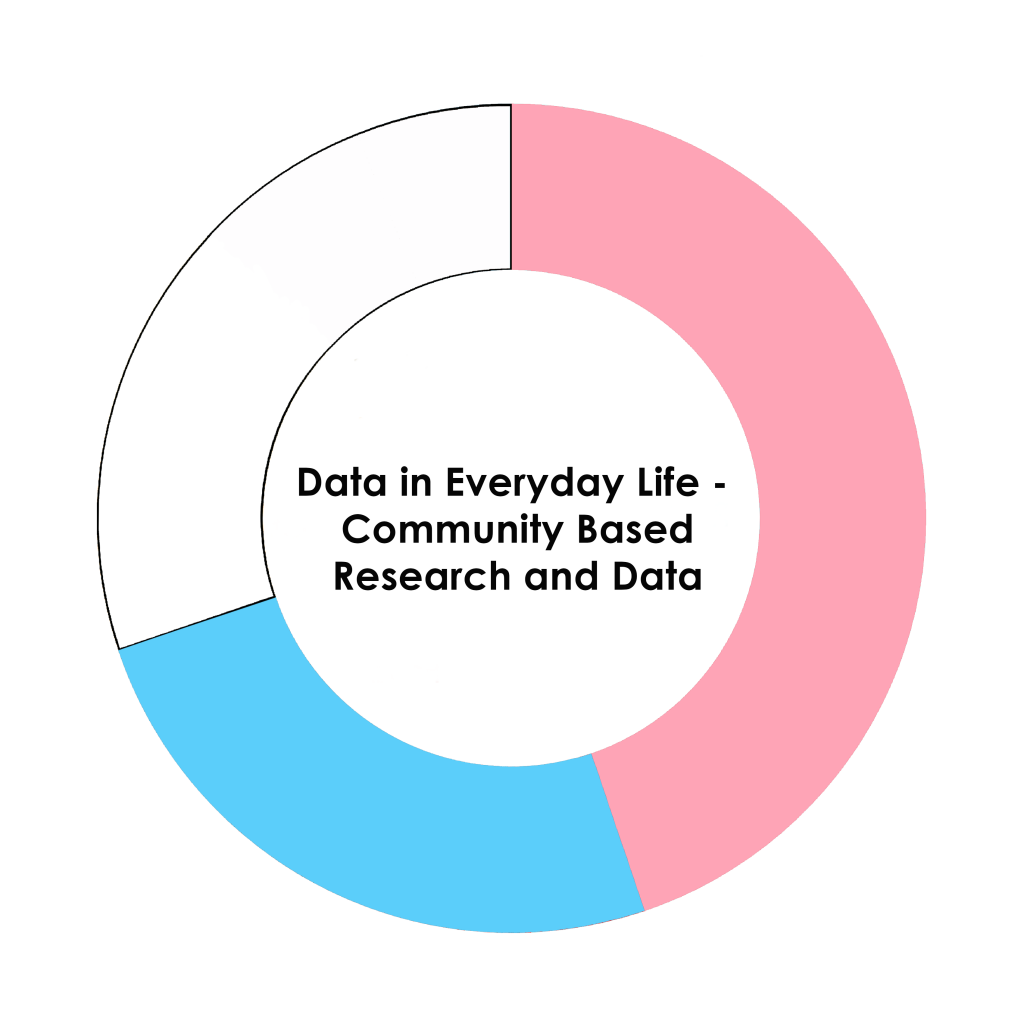
Outline: – What is community data – Example (Trans Sask) – Benefits of community data
Community Based Research, or Community Based Action Research, is a different approach from what we usually think of when we think of research. Instead of a Principle Investigator or a research team developing a hypothesis and working through the research cycle, community based research involves researchers and community stakeholders developing a research project together. This type of process grounds the research in the community by focusing their needs and through direct engagement with the community. The end research and data supports community directed action or change.
For example, last year the Trans Sask organization published their report “So They Know We’re Here.” The report clearly highlights how previous research had low response rates and did not fully engage with the community. Their study was grounded in community-based, decolonized research processes and the result was not only active community engagement, but also data that have previously not been collected or shared. The resulting report of the data highlights aspects of 2SLGBTQ+ people living in Saskatchewan that are rarely covered by the typical reports from Statistics Canada or other larger national reporting agencies. The “So They Know We’re Here” report covers the joys of being trans in Saskatchewan and the reasons why trans people stay in Saskatchewan. This type of reporting shows the reciprocal relationship that is a mainstay of community based research.
Another important highlight of community based research is the community should have control over how the data are stored and shared. Control over data is vital as most community research is done with equity deserving groups that historically have been subjects in research instead of equal partners with researchers. These ideas are similar to and overlap with research practices with Indigenous communities. When working with Indigenous communities, researchers are required to respect Indigenous data sovereignty and use local practices and national and international guidelines such as First Nations Principles of OCAP and the Global Indigenous Data Alliance CARE Principles. The storage and dissemination of data in community research may conflict with open research and data principles, but the community ultimately should have control over their data.
Author’s Note:Please consider supporting local 2SLGBTQIA+ organizations.
Ramadan, the ninth month of the Islamic calendar, is approaching. Ramadan is a time for community, with friends and family coming together to observe the fast. It is a significant month for Muslims around the world, marked by hope and spiritual growth.
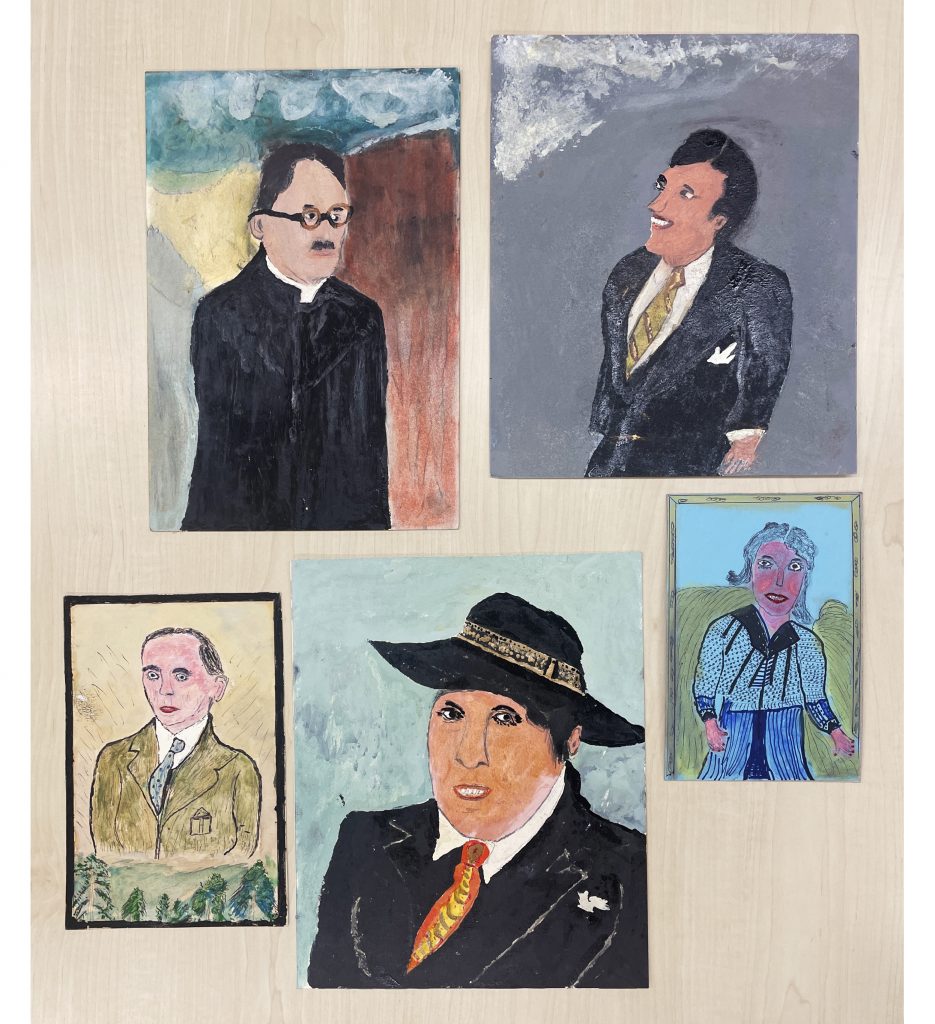
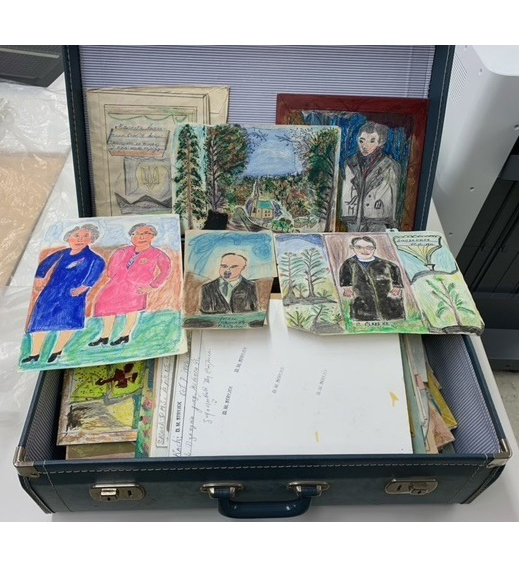
The Dr. John Archer Library & Archives recently received a generous donation of 262 unique pieces of art by the late Dmytro Stryjek from his granddaughter, Judy Harris. Born in 1899 in Ukraine, Stryjek moved to Hafford, SK in 1923. After his retirement from the Canadian National Railway in 1965, he began drawing and painting in earnest, inspired by the religious imagery of the Ukrainian church. Stryjek’s colourful folk art is the product of a curious mind and can be found in collections all across Canada.
Dmytro passed away in 1991 in Saskatoon, SK. Heartfelt thanks to Ms. Harris for this amazing donation.
In 2023 the University of Regina Press celebrates its 10th year of publishing. It’s also the 50th anniversary of its predecessor, the Canadian Plains Research Center. The Dr. John Archer Library & Archives has all of their approximately 400 publications. We’ll showcase selected titles in our display case and online throughout the year.
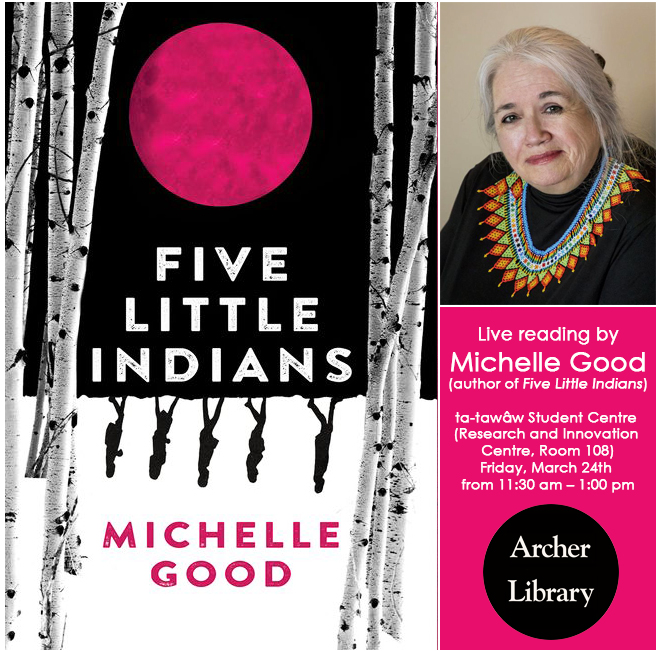
The Dr. John Archer Library & Archives and the ta-tawâw Student Centre are pleased to welcome Michelle Good, author of the award-winning novel Five Little Indians. Please join us at the ta-tawâw Student Centre (Research and Innovation Centre, Room 108) on Friday, March 24th from 11:30 am – 1:00 pm. Michelle Good will read passages from the novel Five Little Indians, followed by a question and answer session.
This event is part of the One Book One Province program organized by the Saskatchewan Library Association. The program will see libraries, book clubs, and individuals all across Saskatchewan join together in March 2023 to read this book and share discussions about the story.
Michelle Good is a member of the Red Pheasant Cree Nation. She has worked for Indigenous organizations from the time she was a teenager. She obtained her law degree at the age of 43 and worked primarily with Residential School Survivors. In 2014 Ms. Good obtained her Master of Fine Arts Degree in Creative Writing from UBC. Five Little Indians is her first novel. It has won several awards, including the Governor General’s Literary Award for Fiction, the Amazon First Novel Award, and the Rakuten Kobo Emerging Writer Award.